What Should Hospitals Measure in an OPD Queue?
Patient Waiting Time Needs a Clear Start and Stop
Patient waiting time needs one agreed starting event and one agreed ending event. In a typical OPD, a hospital may measure from billing completion until the doctor checks in the patient for consultation. In that definition, waiting time is the doctor check-in time minus the billing time. Another hospital may begin after registration, but it must apply that definition consistently. The average shows the total waiting time divided by all measured patients. The median shows the middle patient and is less affected by a few unusually long waits. Hospitals should review both. Clear start and stop events make comparisons across days, doctors and departments meaningful.
Service Time Is Different From Waiting Time
Waiting time records the period before a service begins. Service time records how long the service itself takes. They should remain separate because they describe different parts of the OPD journey. At registration, service time may run from the staff member opening the patient record until registration is completed. For consultation, it may run from doctor check-in until consultation completion. In diagnostics, it may cover the configured interval during which the test is performed. A long wait does not always mean the service was slow. Likewise, a short wait can hide an unusually long service stage. Measuring both shows whether time accumulated before or during care delivery.
Throughput and Queue Length Show Whether Demand Is Building
Throughput is the number of patients served during a defined period, such as one hour. Queue length is the number waiting at a specific time. Hospitals should compare patients arriving per hour with patients served per hour. If thirty patients arrive between 9 a.m. and 10 a.m. but a department serves twenty, the queue grows by ten before considering earlier patients. Doctor-wise and department-wise queue lengths show where this pressure is collecting. A daily total can hide a sharp morning build-up that clears later. Hourly arrivals, hourly throughput and live queue length together show whether demand is stable, increasing or reducing during an OPD session.
How Can Hospitals Locate an OPD Queue Bottleneck?
Map Where Time Is Spent Across the OPD Journey
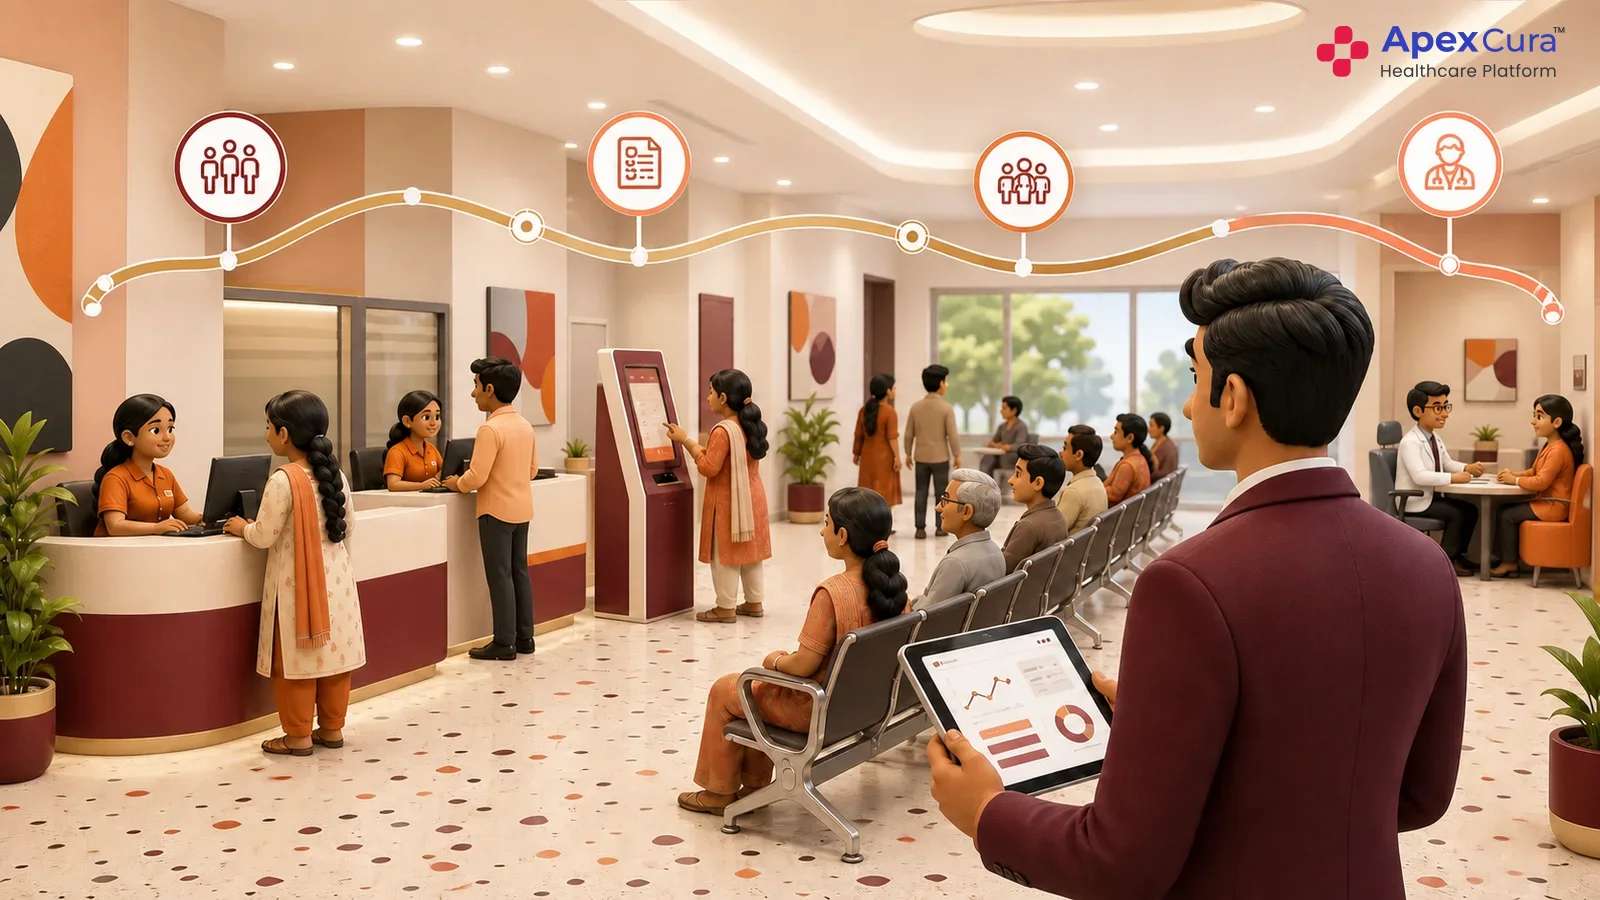
Start by placing the measured intervals in the order a patient experiences them. A common journey may include arrival, registration, billing, vitals, consultation and diagnostics. Not every hospital or patient follows every stage, so teams should map the actual configured flow. Compare the time spent waiting before each stage with the time spent receiving that service. If most of the delay appears after billing but before consultation, the investigation belongs there. If registration service time rises during one shift, examine that stage instead. This simple map prevents a crowded consultation area from hiding a delay that began earlier in the patient journey.
Understand the Patient Types, Delay Types & Core Reasons
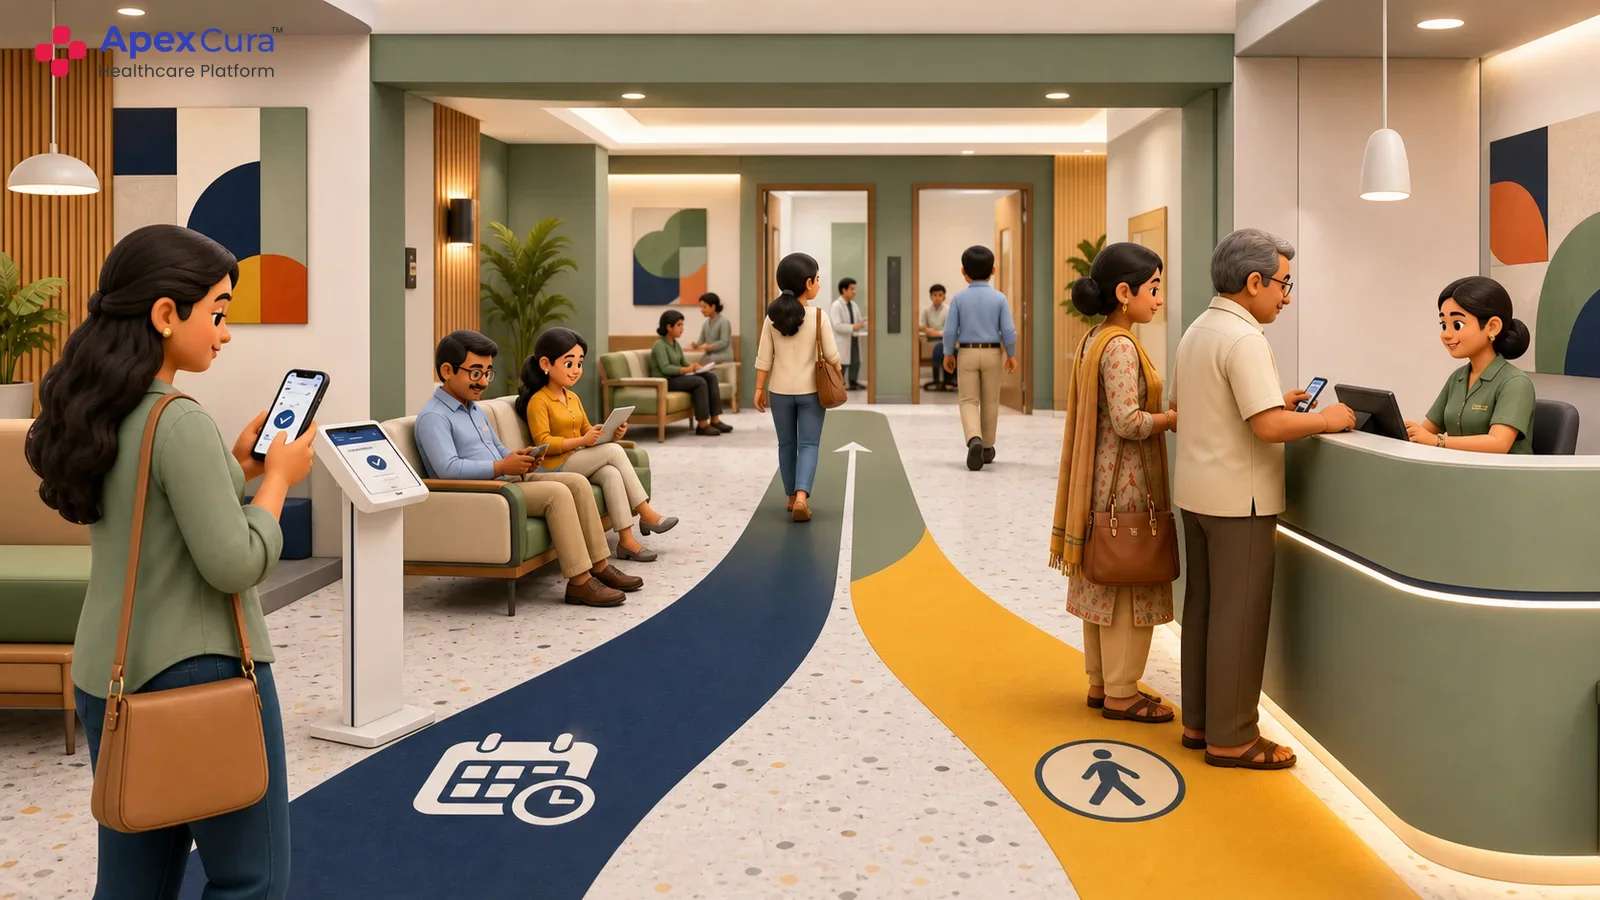
Not every patient enters or moves through the OPD in the same way. Separate appointments from walk-ins, new consultations from reviews and routine patients from authorised priority cases. Then identify the type of delay. A patient may wait before registration, billing, vitals or consultation. Another delay may involve a stalled handoff, longer service or a status that was not updated. Record the visible reason where it is known, such as a late arrival, crowded appointment slot, pending vitals, room change, doctor unavailability or emergency interruption. These categories help teams see which patients are affected, what kind of delay occurred and which reasons require closer investigation.
Separate Demand Problems From Process Problems
A demand problem occurs when patients arrive faster than the available service can handle them. For example, many appointments and walk-ins may reach a hospital between 9 a.m. and 11 a.m. A process problem occurs when available capacity is not moving patients as expected. Registration may pause, vitals may remain pending, a consulting room may be unavailable or status updates may not be recorded. Doctor delay is one possible cause, but it should not be the default explanation. Compare arrivals, service time, queue movement and operational events. Then speak with the floor team to confirm whether demand, process or both created the bottleneck.
Measure OPD queues, identify bottlenecks and act while patients are still waiting.
Explore OPD Queue ManagementHow Can Hospitals Manage Queues and Improve Week by Week?
Set Clear Queue Targets for the OPD
Each hospital should define what acceptable waiting looks like for its OPD. One useful target is the percentage of patients seen within a chosen time, such as thirty minutes after the hospital’s defined readiness event. Teams may also set a queue-length threshold or flag patients waiting beyond a chosen limit. These are hospital-specific operating targets, not universal standards. A busy specialty clinic and a routine review clinic may require different expectations. Keep the targets few, clear and easy for floor teams to understand. For every target, define the patient group, starting event, ending event, reporting period and person responsible for reviewing exceptions.
Monitor the Live Queue and Intervene Early
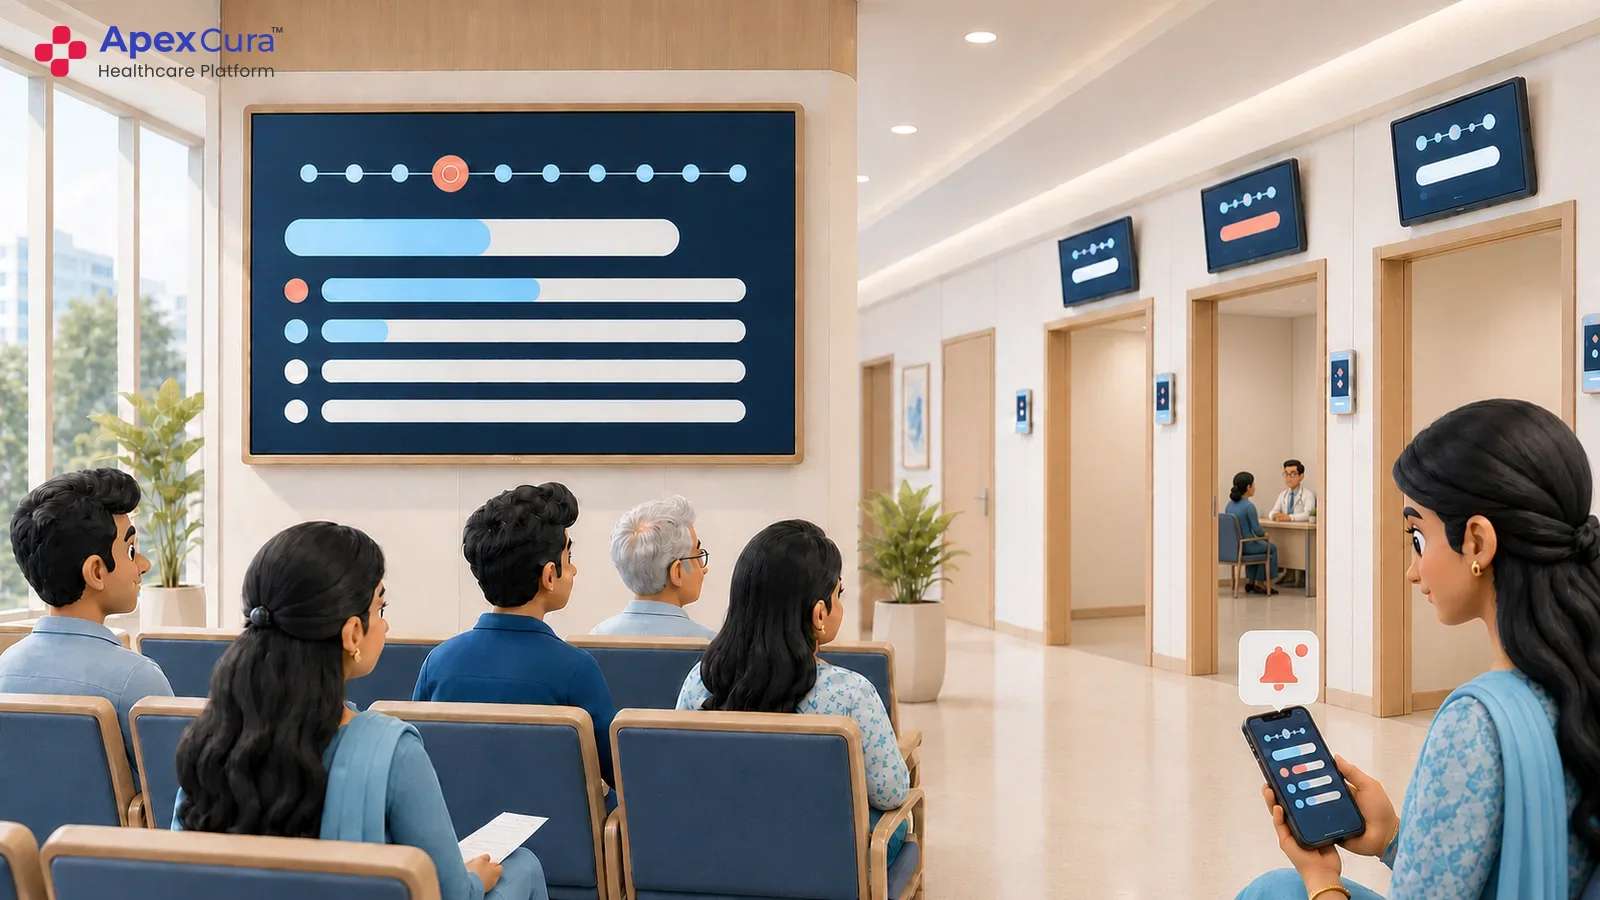
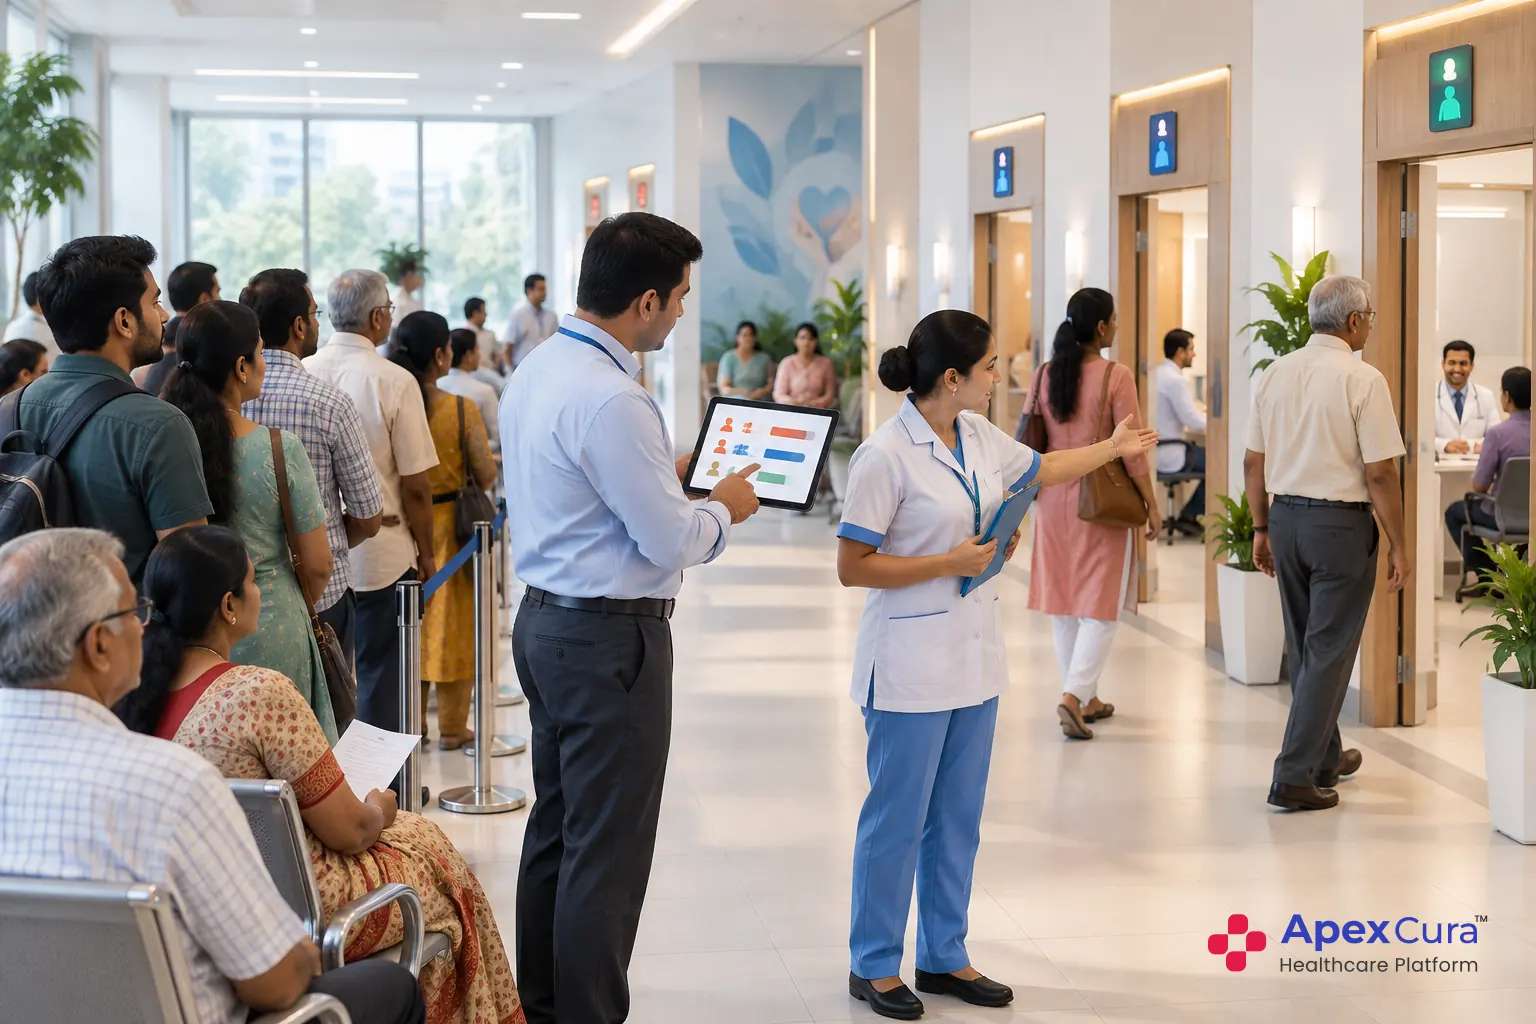
Live queue monitoring is a floor-management activity, not merely a dashboard exercise. The OPD supervisor and nurses should watch for patients crossing the chosen waiting threshold, queues that stop moving, pending vitals, room changes and delayed handoffs. They can confirm urgency, coordinate the next handoff, guide patients to the correct waiting area and keep authorised priority decisions visible to the team. Apex Cura QMS enables this work by showing waiting patients, queue movement, doctor availability, delays and relevant status changes in real time. The system provides visibility; the floor team verifies what is happening and takes the appropriate operational action while patients are still present.
Review Queue Numbers and Patient Feedback Every Week
A weekly review should combine queue numbers with what patients actually report. Compare waiting time, service time, queue length and the percentage seen within the chosen target. Alongside these measures, review feedback collected through the hospital’s approved feedback process. Simple inputs may include a one-to-five waiting-time rating and patient comments. Look for repeated themes such as unclear queue order, missing updates, delayed vitals or confusion about rooms. Then check whether both the measured numbers and patient comments improve across successive weeks. One good day is not enough. Keep the management loop simple: set targets, watch live queues, intervene on the floor, review data and feedback, then refine.
Conclusion
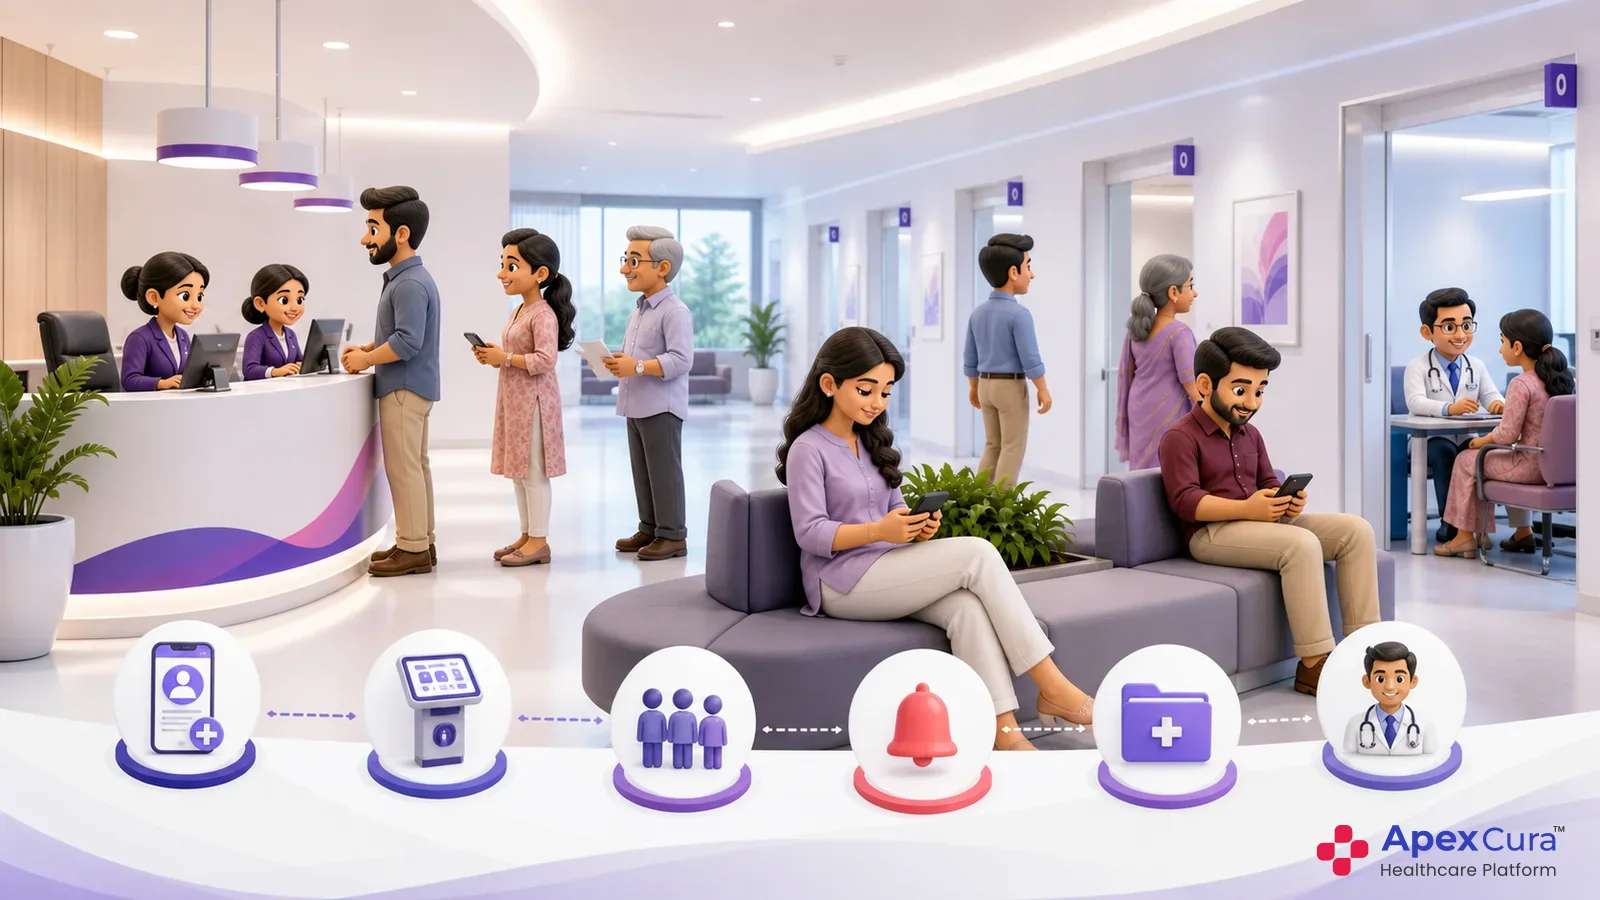
Hospital queue improvement follows a continuous loop. Capture reliable events, measure waiting and service time, understand where queues build, monitor current conditions, act early and measure again. Clear definitions make the numbers comparable. Fair analysis helps teams separate demand pressure from process delays without automatically blaming doctors. Live visibility makes intervention possible while patients are still waiting, while historical review shows whether the same problem returns. Hospitals should also monitor adoption so the data represents actual OPD activity. Explore how an OPD queue management system can support this measurement and action cycle across hospital operations with clearer operational control daily.